Top 10 Customer Retention Metrics & How to Measure
- August 31, 2023
- 22 mins read
- Listen

Retaining your existing customers is a lot cheaper than attracting new ones. It’s equally important to work on reducing the churn rate and stop your customers from leaving. Tracking popular customer retention metrics can help you gain insights into how happy your customers are.
It would, however, be a mistake if you focus less on retention and more on acquisition. It might lead to a high rate of churn – a serious issue faced by many SaaS companies today.
If your company is also churning users, make sure you regularly measure and analyze the retention metrics. This will help you know who is churning, why is churning, and when.
In this post, we will explore B2B and B2C customer retention metrics in detail, understand the definitions and types, how to measure them with formulas, why to measure these metrics, and also look at the importance of using these metrics.
What are Customer Retention Metrics?
Customer retention metrics are factors or variables that businesses use to assess their ability to retain customers over a specific time period. These metrics work like indicators as they give insights into customer satisfaction and loyalty levels, and also inform about the engagement level of customers with a company’s products or services.
By using metrics of customer retention, a business can measure the chances of retaining customers, and also determine the overall performance of the operations in a specific time frame. More companies now use these metrics as they realize how retaining customers is more beneficial than acquiring new ones.
When a business regularly tracks and analyzes these metrics, it stands better to understand the behaviors and preferences of its customers, minimize the churn rate, and boost overall satisfaction. All this is essential for improving customer retention and long-term profitability. Plus, a five percent increase in customer retention can boost profits by up to 75%.
B2B Customer Retention Metrics with Formula
See the below table where the B2B customer retention metrics, what you measure, and formulas are included.
|
Metric |
Measure |
Formula |
|
Customer Retention Rate (CRR) |
Percentage of customers retained over a specific period |
(E−N)/S×100 E: Customers at end, N: New customers, S: Customers at start |
|
Customer Lifetime Value (CLV) |
Total revenue expected from a customer over their lifetime |
Avg. Purchase Value × Purchase Frequency × Lifespan |
|
Net Promoter Score (NPS) |
Measures customer loyalty based on the likelihood of recommending |
%\ Promoters – %\ Detractors |
|
Churn Rate |
Percentage of customers lost during a period |
(Lost Customers / Customers at Start)×100 |
|
Upsell and Cross-Sell Rate |
Tracks frequency of upgraded or complementary product purchases |
(Upsells / Total Customers)×100 |
|
Engagement Metrics |
Measures frequency of platform interactions or feature usage |
Total Engagements / Active Customers |
|
Renewal Rate |
Percentage of customers renewing subscriptions |
(Renewed Subscriptions / Eligible Renewals)×100 |
|
Customer Health Score (CHS) |
Composite metric evaluating satisfaction, usage, and interactions |
Weighted Scores of Satisfaction, Usage, and Interactions |
|
Time to Value (TTV) |
The time it takes for a customer to realize value from the product |
Time of Value−Time of Onboarding |
|
Advocacy Metrics |
Measures referrals, testimonials, or case studies |
(Advocates / Total Customers)×100 |
These are the important customer retention metrics for B2B business. Now you can easily calculate your retention metrics by using those formulas.
B2C Customer Retention Metrics with Formulas
Here, B2C customer retention metrics are given with the purpose of measurement and the required formulas.
|
Metric |
Measure |
Formula |
|
Repeat Purchase Rate (RPR) |
Percentage of customers making multiple purchases |
(Repeat Customers / Total Customers)×100 |
|
Purchase Frequency (PF) |
Tracks how often customers make purchases |
Total Orders / Total Customers |
|
Average Order Value (AOV) |
Average revenue per transaction |
Total Revenue / Number of Orders |
|
Customer Loyalty Index (CLI) |
Combines NPS, repeat purchases, and upselling to measure loyalty |
Composite of NPS, Repeat Purchases, Upselling Rate |
|
Customer Satisfaction Score (CSAT) |
Measures customer satisfaction with a product or service |
(Satisfied Responses / Total Responses)×100 |
|
Time Between Purchases |
Tracks the average time between repeat purchases |
The sum of Time Intervals / Number of Intervals |
|
Active Customer Rate |
Percentage of actively purchasing customers |
(Active Customers / Total Customers)×100 |
|
Retention Revenue Rate |
Revenue generated from repeat customers |
(Revenue from Repeat Customers / Total Revenue)×100 |
|
Customer Referral Rate |
Frequency of customer referrals |
(Referred Customers / Total Customers)×100 |
Several companies evaluate these retention metrics on an annual, quarterly, monthly, or weekly basis. The fast-moving SaaS companies may even look at these data daily.
The measurement of customer retention should be easier and time-saving. In this regard, following the formulas to calculate the customer retention metrics is inevitable.
10 Customer Retention Metrics & How to Measure Them
Tracking the retention metrics over time helps improve customer retention. Some of the metrics are mostly used by different industries which are provided below with the calculation process.
The following formulas will help you calculate them easily. All you need to do is put the desired numbers into the given formulas to get metrics instantly.
The below table enlists the 10 most useful customer retention metrics for all types of businesses.
|
Key Metrics |
Formula |
|
Customer Retention Rate |
(Customers at the end of a period – new customers acquired during the period) / Customers at the start of the period x 100 |
|
Customer Lifetime Value |
Customer value x Average customer lifespan |
|
Customer Churn Rate |
(No. of customers at the start of the year – No. of customers at the end of the year) / No. of customers at the start of the year x 100 |
|
Repeat Purchase Rate |
No. of returning customers / No. of total customers x 100 |
|
Net Promoter Score |
% of Promoters – % of Detractors |
|
Product Return Rate |
No. of units sold that were later returned / Total no. of units sold x 100 |
|
Loyal Customer Rate |
No. of repeat customers / Total customers x 100 |
|
Monthly Recurring Revenue |
Average revenue per account x Total accounts in a month |
|
Customer Satisfaction Score |
(No. of satisfied respondents / Total no. of respondents) × 100 |
|
Average Revenue Per User | Total Revenue / Number of Users or Customers |
Now, take a look at how to calculate the metrics of customer retention using formulas.
1. Customer Retention Rate (CRR)
CRR is the most straightforward metric for measuring customer retention. It helps to find the percentage of loyal customers to your business over time. After calculating the CRR, you can see how effective your current strategy is to retain your customers.
What You Measure: Rate of the retained customers of a business over a specific time.
Customer Retention Formula:
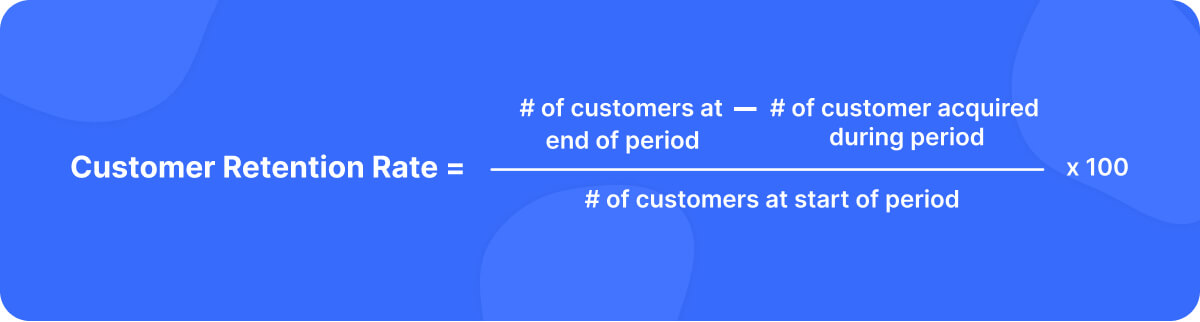
Customer retention rate = (Customers at the end of a period – new customers acquired during the period) / Customers at the start of the period x 100
How to Calculate Customer Retention
The first thing is to determine a time frame whether it can be a month, quarter, or year. Now, find the total number of customers at the beginning of the period, end of the time, and in between, all the customers that were onboarded.
Suppose, considering 1 month of data of a business,
- Customers at the start of the period (S)= 148
- Customers at the end of the period (E)= 211
- New customers acquired during the period (N)= 87
Then, the CRR = (E-N)/S x 100
= ((211-87)/148) x 100
= 83.78%
However, the customer retention rate of the business in 1 month is 83.78% which is a healthy rate. Generally, the business aims to have a customer retention rate of over 85% though it greatly depends on the industry.
Based on the business types and size, if you have a small number of customers, you can calculate the CRR half-yearly or yearly.
2. Customer Lifetime Value (CLV)
The longer a company retains loyal customers, their lifetime values become higher.
Customer lifetime value measures how much revenue you can generate from customers during their lifetime. It’s a metric to track consistently whether you sell individual products or services.
What You Measure: Revenue generated by the most loyal customer
Customer Lifetime Value Formula:
Customer lifetime value = Customer value x Average customer lifespan
Here, consider a specific period-
- Customer value = Average purchase value x Average number of purchases
- Average purchase value = Total revenue / Total no. of purchases
- Average no. of purchase = Total no. of purchases / Total customer no.
- Average customer lifespan = Average no. of years the customer is active / Total no. of customers
How to Calculate the Lifetime Value of a Customer
Suppose, you want to find out the customer groups who have the highest lifetime value. In this case, first, identify the gross annual sales and the unique customer number of that year. From these data, you can get the average revenue per customer per year.
You just need to find out the business data over a specific time to calculate customer lifetime value including average purchase value, average number of purchases, and average customer lifespan.
You can also find out the low lifetime value. For instance, some customers purchased from you when you were offering discounts and then closed their accounts. These customers are considered as having low lifetime value.
3. Customer Churn Rate
Churned customers are those who stopped using your service. So it is one of the crucial metrics to measure your customer retention. When a company faces a high churn rate, it faces a major challenge to retain its customers.
For example, some of your customers might stop using your service because they may have gone through different challenges. It could be their businesses being acquired, they went bankrupt or they chose other service providers.
If your customer churn rate is more than 5 to 7%, then it’s time to rethink.
The main thing is to identify their problems first to reduce your churn rate. Either your product quality or the customer experience with your business can be evaluated.
What You Measure: Rate of customers lost over a specific period.
Customer Churn Formula:
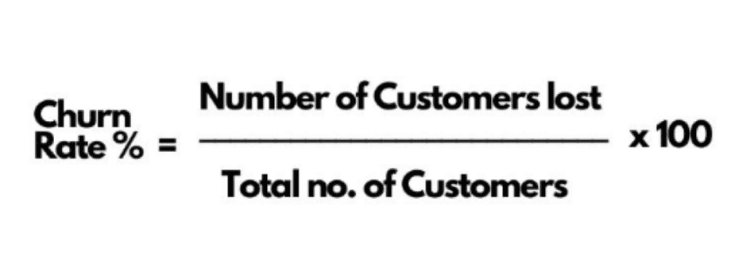
Customer Churn Rate = (No. of Customers at Start of Year – No. of Customers at End of Year) / No. of Customers at the Start of Year x 100
How to Calculate Customer Churn
You may frequently calculate your customer churn rate but it greatly depends on the volume of your customers. Suppose, you have thousands more customers. In this case, you can track the churn rate monthly rather than annually.
Tracking your churn rate over time helps your marketing, sales, & customer success team.
Let’s say, your business started January with 1000 customers. In February, you found that 50 customers left. Then using this formula, you can easily get your customer churn rate which is 5%.
Sometimes, the churn rate and retention rate are a bit confusing. We have covered a blog on the difference between churn rate and retention rate. You can go through it to have a better understanding.
Well, retention rate, CLV, and churn rate are the most commonly used metrics to measure customer retention. So we have discussed those in detail here including the calculation process.
4. Repeat Purchase Rate
The repeat purchase ratio measures the rate of customers that come back to buy from your company again. This metric is a direct indicator of customer loyalty.
By calculating the repeat purchase rate, you can find out which types of customers are making the most repeat purchases. It helps to adjust your target buyer persona for marketing.
Repeat Purchase Rate Formula:
Repeat Purchase Rate = No. of Returning Customers / No. of Total Customers x 100
How to Calculate RPR?
- This metric can be calculated either weekly, monthly, or quarterly, depending on the specific needs of the business
- Now when the timeframe is decided, count the number of customers with at least one purchase
- Calculate the number of customers with repeat purchase
- Put the value into the formula and you will get the ratio
5. Net Promoter Score (NPS)
NPS is a qualitative measure of customer satisfaction and how likely the customers are to refer your business to others. It is a customer loyalty score, ranging from -100 to 100. You can explore what is a good Net Promoter Score.
If you compare your Net Promoter Score to the rate of revenue growth and customer churn, you can predict the potential growth through referral and retention.
According to the London School of Economics, “An average NPS increase of 7% correlates on average with a 1% growth in revenue.”
It’s just a simple question you can ask your customer to determine the score like “How likely are you to recommend us to a friend or colleague?”
Net Promoter Score Formula:
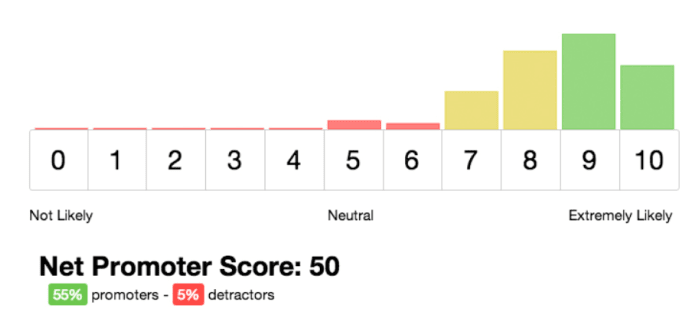
Net Promoter Score = % of Promoters – % of Detractors
How to Calculate NPS?
- Calculate the number of promoters
- Count the number of detractors
- Subtract the percentage of detractors from promoters
Go through to learn effective strategies to improve the Net Promoter Score of your business.
6. Product Return Rate
The product return ratio measures the rate of returned products. Though the products could be returned for various reasons, the ultimate goal is to keep this as low as possible.
In customer retention strategy, product returns can be extremely problematic, especially for the B2B business. Generally, the product return rate of B2C retailers for online stores is 20% and in-store 9%.
A return rate compares the number of units returned against the number of units sold. To calculate your return rate, divide the number of units returned by the number of units sold, multiplying the product by 100 to find your percentage.
The product return rate is the most important data for the customer success team to find out the exact problem.
Product Return Rate Formula:
Product Return Rate = No. of Units Sold That Were Later Returned / Total No. of Units Sold x 100
How to Calculate Product Return Rate?
-
- Choose a specific timeframe for which you want to calculate the return rate
Count the total number of units sold during the period - Count the total number of sold units returned
- Now put the numbers in the formula and get the return rate
- Choose a specific timeframe for which you want to calculate the return rate
7. Loyal Customer Rate
Your loyal customers are the most valuable so it’s crucial to know how many customers are loyal to your brand. This metric measures the number of buyers who made repeat purchases during a month, quarter, or year.
This includes both new and existing customers. The loyal customers of your business act like brand ambassadors. You can have a look at the ways to increase your loyal customer base.
Loyal Customer Rate Formula:

Loyal Customer Rate = No. of Repeat Customers / Total Customers x 100
How to Calculate Loyal Customer Rate?
- First of all, determine the number of loyal customers your business has
- Determine the time range for which you want to calculate the loyal customer rate
- Count the number of loyal customers for the time range you have chosen
- Count the total number of customers who purchased during that time range
- Now, divide the total loyal customers by the total number of customers
8. Monthly Recurring Revenue (MRR)
Monthly Recurring Revenue (MRR) is a key retention metric to track and predict revenue streams. SaaS companies use this metric to predict the stable revenue they generate from ongoing subscriptions or recurring billings.
Measuring MRR helps in calculating the total revenues that a company can expect on a monthly basis from its active subscribers. This metric is important to understand customer retention rates better and analyze the financial health of the business on a monthly basis.
The use of MRR is also beneficial for tracking the effectiveness of sales and marketing efforts. More importantly, a business can predict future revenue and do apt resource allocation based on measuring MRR.
Monthly Recurring Revenue Formula:
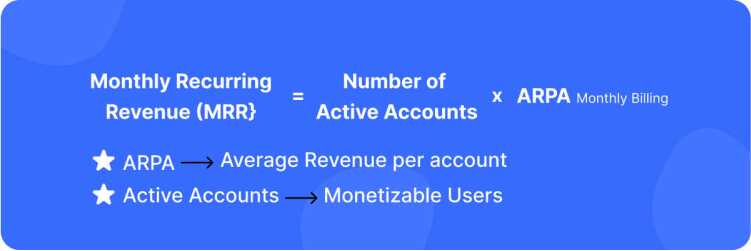
Monthly Recurring Revenue (MRR) = Average Revenue Per Account x Total Accounts in a Month
How to Calculate MRR?
- Determine the average revenue per account (ARPU)
- Consider only the active account
- Multiply ARPU by the total number of active users
9. Customer Satisfaction Score (CSAT)
The CSAT is one of the most widely used metrics for measuring the level of satisfaction that customers have with a business or its product or service. This metric is used by many companies to gauge the overall satisfaction level of customers. To measure the CSAT, a survey or feedback form is used that helps in understanding how well a business is meeting customer expectations.
In the survey, the question that is asked is, “How satisfied are you with the product or /service or experience provided by the company]?” The response is generally categorized as “Very Satisfied”, “Satisfied”, “Neutral”, “Unsatisfied” and “Very Unsatisfied”. Based on the responses to the CSAT survey, a business can easily understand the level of customer satisfaction and then know the areas for improvement.
Customer Satisfaction Score Formula:
CSAT Score = (Number of Satisfied Respondents / Total Number of Respondents) × 100
How to Calculate the CSAT?
- Count the total number of respondents
- Count the respondents who said they are “Very Satisfied” or “Satisfied”
- Divide the number of respondents who are Satisfied by the total number of responders
- Multiply it by 100 to get the score
10. Average Revenue Per User (ARPU)
For subscription-based business, it’s important to know the average revenue generated by each user over a specific period. If your business is also in a service-oriented industry, you need to measure the Average Revenue Per User (ARPU) metric regularly. It will help you know the average value that each customer adds to your overall revenue stream.
Average Revenue Per User Formula:

ARPU = Total Revenue / Number of Users or Customers
How to Calculate ARPU?
- Choose the time range for which you want to calculate ARPU
- Calculate the total revenue generated by your business for that time range
- Determine the total active users or customers for the mentioned time rate
- Now divide the total revenue by the number of customers and you will get the ARPU
Why Measure Customer Retention Metrics?
Customer retention metrics offer a detailed view of your business’s relationship with its customers. Measuring them can empower your business to make informed decisions and tailor strategies to forge lasting customer relationships. Sadly, only 18% of customers focus on customer retention.
There are many reasons why you should measure these metrics –
- Understanding Customer Behavior – Retention metrics offer a comprehensive peek into how customers interact with your products or services. The data can help you understand customer pain points and behavior better.
- Identifying Causes for Churn – Tracking and measuring retention metrics can offer you all the factors and causes behind customer churn. You will know all the factors responsible for the churn and then take the right steps to reduce churn.
- Analyzing Impacts of Strategies – Retention rates often depend on a number of different factors and knowing them all is the first step towards minimizing churn. When you measure the retention metrics, you will basically analyze the impacts of various strategies on keeping customers with the business.
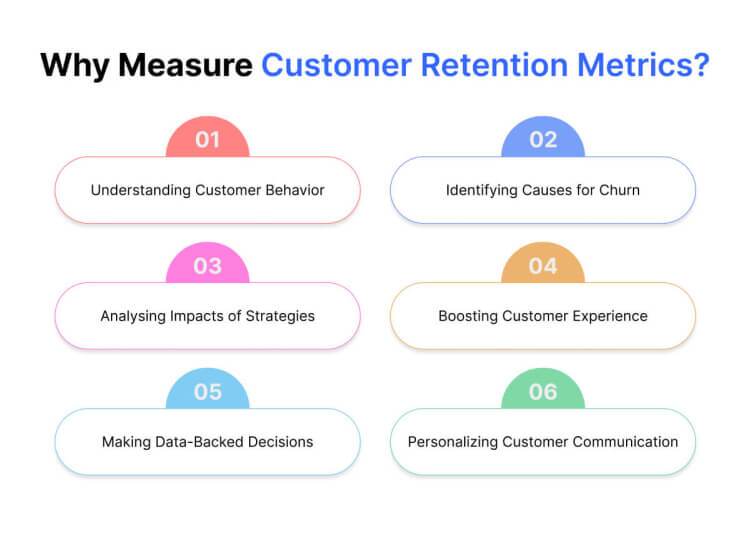
- Boosting Customer Experience – Customers are more likely to stay loyal when they have a good experience which is not possible unless a business understands their needs and meets their expectations. Measuring retention metrics can prove valuable in understanding customers and enhancing their overall experience with your brand.
- Making Data-Backed Decisions – Measuring customer retention metrics provides you with tons of customer-related data that can be used to validate business decisions. The data can let you understand whether your marketing spend is right, whether the budget is being allocated aptly whether pricing strategies are standard, and so on.
- Personalizing Customer Communication – A business that measures retention metrics can do an effective customer needs assessment, so better understands customers, their needs, and behaviors. So, it can tailor messages and personalize communication to address specific segments. This will boost the rate of engagement and loyalty.
A Step-By-Step Guide on How to Measure Customer Retention
Measuring customer retention is essential to understanding and managing the churn rate. It’s also vital to devise strategies for achieving customer happiness. When you regularly measure customer retention, you get valuable insights into the strength of your customer relationships and identify areas of improvement.
Let’s look at how to measure customer retention –
Step 1. Set Clear Objectives
Before you measure customer retention, you need to set clear objectives for doing that. You need to know how it will align with your business goals. Whether you want to reduce the churn rate or increase repeat purchases, you need to know, and lay out, the reason for measuring customer retention.
Step 2. Select Relevant Metrics
There are many metrics you can rely on when it comes to measuring customer retention. The Key is to choose the ones that suit your business contexts well. From churn rate to average customer lifespan, customer retention rate to CLV, you can choose the metrics that resonate well with your business goals.
Step 3. Segment Your Customer Base
Since your business has different customer segments, analyzing retention rates for them separately can give deep insights into the broader factors affecting retention. That’s why you first need to consider segmentation of your customers based on key parameters such as demographics, engagement levels, or purchasing patterns.
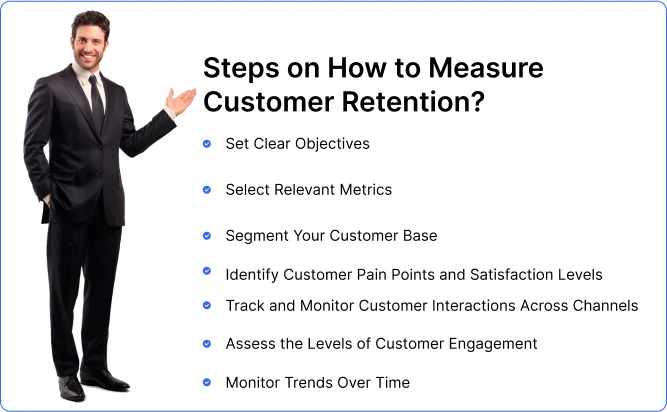
Step 4. Identify Customer Pain Points and Satisfaction Levels
When you plan to measure customer retention, the priority should be on identifying customer needs, pain points, and satisfaction levels. These factors will give detailed insights into reasons for churn. So, you must consider implementing surveys and collecting feedback regularly.
Step 5. Track and Monitor Customer Interactions Across Channels
A deep understanding of how customers engage and interact with your brand across channels can help you know their levels of satisfaction. Make sure you monitor customer interactions across touchpoints and channels to analyze their behavior and find areas for improving retention.
Step 6. Assess the Levels of Customer Engagement
The more your customers are engaged with your brand, the higher levels of retention rates you can expect. Customers’ levels of engagement are a good indicator of understanding their likelihood of churn or retention. That’s why you need to measure their engagement such as website visits, email response rates, app usage, etc.
Step 7. Monitor Trends Over Time
How would you know whether or not your retention rate is satisfactory? There are two ways – first, you need to compare your rates against the industry benchmarks, and second, you need to compare it against your competitors. After that, you need to monitor retention metrics over time to see the trends if any, and implement strategies.
How to Boost Customer Retention Rates?
Customer retention is vital for the growth of a business. The more you retain customers, the better impact it will have on your brand value, sales, and revenue. There are some useful strategies you can use and drive retention rates.
Here are key tips to boost customer retention rates –
- Offer Excellent Customer Service – Happy customers stick more and buy more. To boost customer happiness, you need to offer excellent support and quick replies to their queries. You need to ensure a positive experience at every touchpoint if you want to improve customer satisfaction with your business.
- Personalize the Experience – Customers love personalized experiences. If you can personalize customer experiences, it will help you forge a deeper connection with them and you can increase their loyalty to your brand. Using customer data and insights is key to personalizing your offers to the specific needs of the customer.
- Offer Loyalty Programs – Implementing a well-planned loyalty program is key to rewarding customers for repeat purchases and engagement they do with your brand. You can consider offering incentives such as reward points, exclusive offers, or discounts to show how much you value their loyalty to your business.
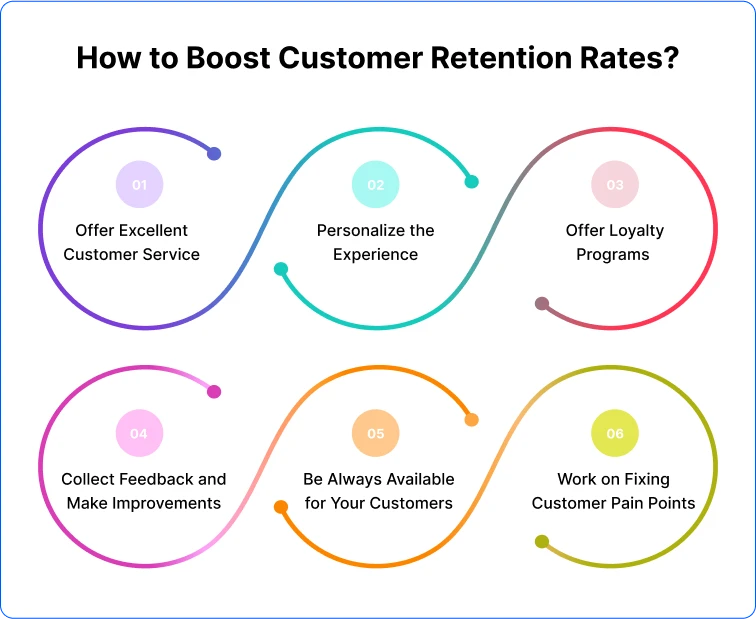
- Collect Feedback and Make Improvements – You should regularly collect feedback if you want to identify areas for improvements and improve the customer experience. You can gather feedback through surveys, and may also rely on reviews to make needful changes to your retention strategies.
- Be Always Available for Your Customers – When you are always available for your customers, you win their trust and confidence. You also win their faith by staying consistent across channels and maintaining uniformity in your messaging and communication across all channels.
- Work on Fixing Customer Pain Points – It’s important to understand your customer’s needs, preferences, and pain points so that you can fix any problem they may face. Together with offering great support, ensure you hear their issues immediately and resolve them quickly.
Final Thoughts
Customer retention is the backbone of sustainable growth, and measuring it effectively is key to unlocking its full potential. Whether you’re operating in B2B or B2C, tracking the right metrics—like Customer Lifetime Value (CLV), Churn Rate, Repeat Purchase Ratio, and Net Promoter Score (NPS)—provides invaluable insights into customer behavior and loyalty.
For B2B, metrics like Account Retention Rate and Customer Health Scores help gauge long-term partnerships, while B2C focuses on transactional indicators such as Purchase Frequency and Average Order Value. By understanding and acting on these metrics, businesses can identify areas for improvement, tailor strategies, and build stronger relationships.
Ultimately, customer retention isn’t just about numbers—it’s about creating value that keeps customers coming back. By consistently monitoring and optimizing these metrics, you’ll not only retain customers but also turn them into loyal advocates who drive your business forward. Measure wisely, act strategically, and let data guide your path to lasting success.