Top 9 Customer Satisfaction Metrics + How to Measure
- January 16, 2025
- 19 mins read
- Listen

Whenever you interact with a customer, they will never tell you if they are satisfied or not with your services. This is because customers are not really forthcoming with this sort of information. Thus, to find out about their state of mind, we can make use of customer satisfaction metrics.
Using such measurements, we can determine the satisfaction level of a customer, enabling us to serve them better. As customer satisfaction is extremely important for a business, these metrics serve as a guiding light for success.
Hence, let’s talk about customer satisfaction, the different metrics, how they will benefit your business, and more.
What is Customer Satisfaction?
Customer satisfaction is a concept to describe how users feel about your business and the products or services. The term allows us to quantify the happiness of a customer when they interact with our company.
This is where customer satisfaction metrics can help, as they can measure how satisfied the customers are with your products, services, etc.
These metrics not only improve customer experience but also give the company a 360-degree view of how a customer interacts with their business. Hence, let’s transition to the benefits of using customer satisfaction metrics.
Benefits of Customer Satisfaction Metrics
While measuring the metrics can take some work, it can yield a lot of benefits. Here are some of the key benefits of calculating customer satisfaction metrics.
- Increases Customer Loyalty: Through metrics, you can identify whether your services or products are lacking. Hence, you can improve in those areas in order to boost customer satisfaction, which drives loyalty towards your business.
- Higher Retention Rates: Using these metrics, you can improve customer retention rates by solving the problems users have with your business. You can identify the problems customers are facing via surveys or collected data.
- Lower Churn Rate: Similar to retention rates, customer churn rate also decreases when you start addressing pain points identified via surveys. Thus, rolling out improvements will elevate the customer’s experience and benefit your business as a result.
- Increases Customer Lifetime Value: While using metrics, you improve customer satisfaction, and that increases CLV (or CLTV) over time.
- Improves Customer Acquisition: When customers are happy with your business, they are likely to promote your company to their friends and family. Also, satisfied customers leave positive reviews on your platforms.
9 Key Metrics to Measure Customer Satisfaction
Here are the nine important customer satisfaction metrics that you should use for your business.
Customer Satisfaction Score (CSAT)
Yeah, there is a metric that directly measures customer satisfaction ratings. CSAT does that through surveys or questions asked to customers and then getting an average of all the scores.
CSAT measurement is usually done in two ways.
- Question using a scale of 1 to 5
OR - Using emoticons from sadness (score: 1) to happiness (score: 5)
This way, customers can express how they feel about your business strategy. However, there is a limitation with measuring CSAT scores, as it relies a lot on customers giving their thoughts, which can be very biased.
Hence, relying entirely on CSAT for customer satisfaction is not the best of ideas. But it is one of the easiest ways to find out what customers think of your business and if they are happy with their interactions with you.
How to Measure CSAT?
Customer satisfaction score can be measured through the following means.
- Surveys
- End of a Conversation with a Chatbot or Live Chat
- After Purchasing a Product or Service
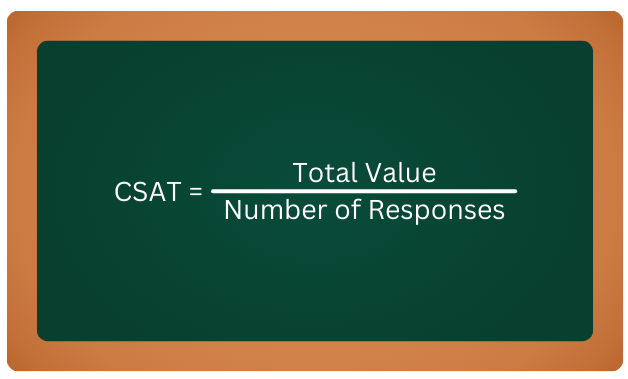
After collecting the scores through these means, you add up all of the values and divide it by the number of responses you received. That is your business’ CSAT score. Below is the formula to calculate customer satisfaction.
Example of a CSAT Question
CSAT questions usually are structured as follows.
Question: Please rate your overall satisfaction with REVE Chatbot.
Score:
- Very Unsatisfied
- Unsatisfied
- Neutral
- Satisfied
- Very Satisfied
Net Promoter Score (NPS)
NPS targets a different angle of customer satisfaction as it measures how likely customers are to recommend your product or services to their peers. It is usually measured on a scale of 1-10 but that can vary.
From the scale, you separate the scores into three categories: Promoters, Passives, and Detractors.
- Promoters: Customers that are extremely satisfied with your products that they will promote them to their family or friends. (Usually, 9 or 10 on a 0-10 scale).
- Passives: These customers are satisfied with your product, but they will not be promoting it. (Usually, 7 or 8 on a 0-10 scale).
- Detractor: These are customers who are unlikely to buy from you again and might even negatively affect your business by discouraging potential future consumers. (Usually, 0 to 6 on a 0-10 scale).
Using these categories, Net Promoter Score is calculated by comparing the number of promoters and detractors.
This metric is extremely important for a business as it lets you understand the satisfaction level of a customer and how likely they are to get users to promote their business.
How to Measure Net Promoter Score?
NPS can be measured through the following means.
Periodic surveys to periodically (monthly, quarterly, annually, etc.) ask loyal customers about their sentiment towards your business.
Immediate surveys or questions can be asked to a customer once they buy a product or service.
Periodic surveys are better than immediate ones, as the latter could be annoying to many customers, while the former usually lands better with your user base. Thus, it is important to ask NPS questions without annoying your customers or asking them too soon before they have formed an opinion.
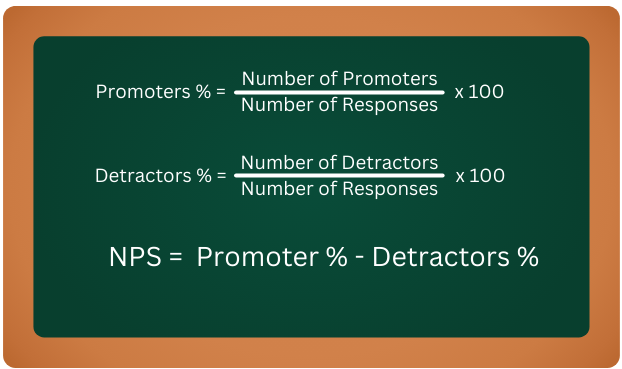
After collecting the scores through surveys, you have to find the percentage of promoters and detractors individually from the overall responses. Afterward, you simply subtract the percentages to find your NPS score. All the formulas you need are as follows.
Example of a NPS Question
NPS questions usually are structured as follows.
Question: How likely are you to recommend REVE Chat to your peers?
Score: 0 (Not Likely at All) to 10 (Extremely Likely).
Customer Effort Score (CES)
Contrary to the other metrics mentioned so far, CES is a customer satisfaction metric used to find out how easy it was for a customer to buy a product or service. Customer Effort Score can also find out how easy it was to interact with your business.
CES can be very important, as understanding the ease of interactions for customers can help you attract more by highlighting how seamless you have made your services to be.
The scale used for CES questions can differ from one question to another and also from one company to another. It simply depends on the type of question or company.
How to Measure Customer Effort Score?
CES can be measured through the following methods:
- Immediate surveys or questions asked to a customer once they buy a product or service or after they have completed an interaction with your business
- Sending surveys through our website, mobile app, email survey, etc.
Unlike NPS, CES is something that is very effective when sent at certain triggers. This process can be automated with a software like REVE Chat, where you can set the conditions of the triggers on your website, and just like that, customers are asked these questions.
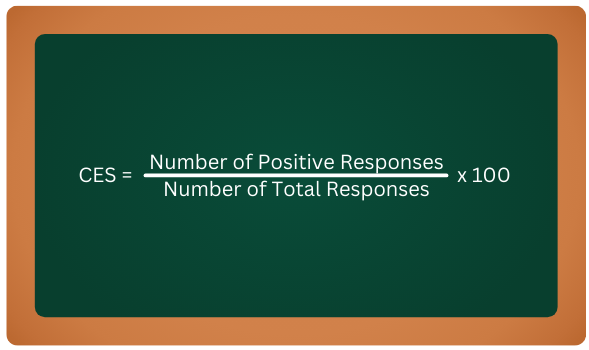
After collecting the responses, the results are converted from 0-100 for CES. To do that, we first find out the number of positive responses (4 or 5 on a 1-5 scale) and then use the following formula.
Example of a CES Question
CES questions usually are structured as follows.
Question: How easy was it to explain your issue with our representative today?
Score:
- Very Difficult
- Difficult
- Neutral
- Easy
- Very Easy
Customer Health Score (CHS)
CHS is a metric to check customer retention and analyze the risk of a customer churning. This allows businesses to analyze whether you can retain a customer and even potentially upsell to them.
While that sounds like a great metric, and it is, the problem lies with measuring it. To do so, there is a fair bit of work needed, such as what to measure, what the scores on the scale mean, and so on.
However, if you can nail down those details, Customer Health Score can be an incredible indicator that can be used to improve your business.
How to Measure Customer Health Score?
To measure CHS, you have to determine a few things:
- Determine What You Are Measuring: The first step is to figure out which indicator or triggers you want to measure. This could be number of logins, frequently visiting certain products, and so on.
- Creating a Score Distribution: The next step is to determine the score scale as well as the positive and negative actions. Thus, separating the positive and negative actions and adding value to each action as well.
- Collect the Data: Next, you start collecting the data via your reporting system and other data you can track through a software, websites, etc. Arrange that according to the score distribution you set earlier and find a total value of positive and negative responses.
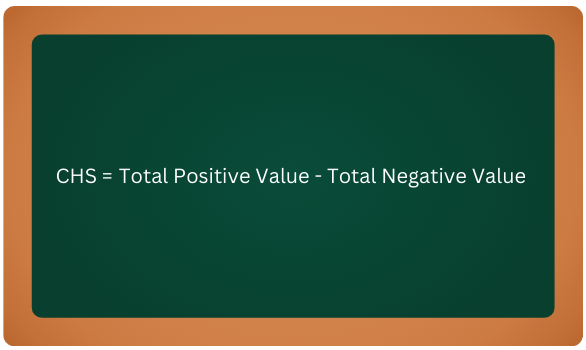
After that, you can calculate CHS by simply calculating the values of positive and negative actions and finding the net value. To visualize this well, there are many tools that will calculate this metric for you.
Our platform can do that for you, as we have a robust data and reporting system that visualizes the health scores for you. A general formula for CHS is as follows:
Example of a CHS Measurement
Unlike some other metrics, CHS is calculated by determining the data you want to use. Let’s explain that with a simple example.
Say that we want to determine a user’s activity on your website. For that we have determined the following actions and scores.
|
Actions |
Score |
Positive or Negative |
|
Spending Less Than One Minute |
25% |
Negative |
|
Viewing Any Product Page |
25% |
Positive |
|
Staying Idle on the Website for Too Long |
25% |
Negative |
|
Interacting with Chatbot or Live Chat |
25% |
Positive |
Next, you check the number of times each action was done by a user, multiply the number with the appropriate score above, and then add/subtract all the total values. That would be your CHS score for a user.
You can follow this example, create a system, and apply it for all users.
Customer Churn Rate (CCR)
Churn Rate is one of the biggest problems for any industry, some facing more trouble than others. Thus, it is important to be able to determine how many customers are churning and what is the rate at which it is happening.
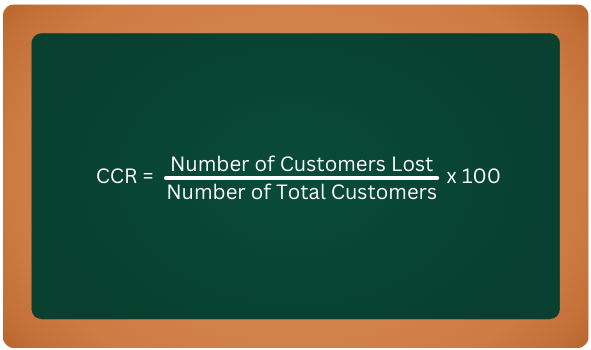
To measure CCR, you would have to determine a certain interval for which you are measuring churn rate. Check how many customers you had at the start and then subtract the number at the end of the interval to find the amount of users lost.
Then, dividing the lost customer number with the user amount at the start, you can calculate the percentage of customers churned.
This metric can really help, as it will allow businesses to identify the problem if there is any and work to improve it so that they can reduce the churn rate.
How to Measure Customer Churn Rate?
To measure customer churn rate, you can use the following steps:
- Pick an Interval: Pick a time period where you are calculating the number of customers and users lost.
- Finding Number of Customers Lost: Collect the data or calculate the number of customers that have stopped using your platform.
- Find Percentage: Divide the number of customers lost by the initial number of users. Then, multiply by 100% to find CCR.
Like CHS, CCR is calculated based on data and does not require any surveys or such. The formula to calculate churn rate is as follows.
An Example of Calculating CCR
Let’s explain this by using an example of calculating churn rate for the month of March. There were 130 customers at the start of the month, and 30 of them stopped using your service at the end of March. So, we divide the number of customers lost (30) with the total number of users at the start of the month (130), which will be 0.231. Then multiply it by 100% to find the churn rate to be 23.1%.
Customer Retention Rate (CRR)
Unlike churn rate, customer retention rate measures the number of customers you retained in a certain period of time. Retaining customers is extremely necessary for a business to ensure a constant revenue stream.
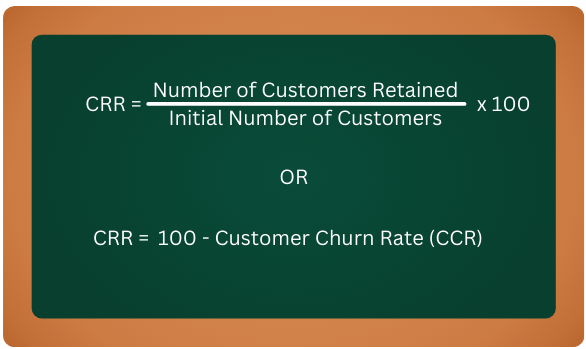
Like churn rate, you measure CRR in a similar way by comparing the customer numbers. Checking the number of old customers at the end of the month to the amount of users at the start of the month will allow you to calculate the customer retention rate.
Alternatively, you can also subtract customer churn rate from 100%, which will also give you your retention rate.
How to Measure Customer Retention Rate?
To measure customer retention rate, you can use the following steps:
- Pick an Interval: Pick a time period where you are calculating the number of customers and users gained.
- Note Down Number of New Customers: Keep a log of how many new customers subscribed during this time period.
- Find Number of Retained Customers: By subtracting the total number of customers at the end of the time period from the amount of new customers, you will get the number of customers you retained.
- Find Percentage: Divide the number of customers retained by the initial number of users and then multiply by 100% to find CRR.
As mentioned earlier, you can calculate CRR by subtracting CCR from 100% to find the value.
Like CCR, CRR is calculated based on data. There are two formulas to calculate retention rate.
An Example of Calculating CRR
Let’s use a similar example as we did for CCR to calculate customers retained in March. There were 130 customers at the start of the month and at the end of the month, the number stayed at 120. So, first note down the number of customers gained during the month, which is 20 new customers.
Then, subtract the number of users at this moment with the new customers gained, which amounts to 100. Divide this number with the total number of users at the start of the month (130), which will be 0.769. Then multiply it by 100% to find that the retention rate is 76.9%.
First Response Time (FRT)
First Response Time, also known as First Response Rate, is a metric that measures the average time it takes for your customer support agents to respond to a customer in live chat. This metric determines the initiation of a conversation with a customer and is one of the indicators to measure how good your customer support system is.
However, this is not to be mistaken with First Contact Resolution (FCR), which is a different metric. With FRT, you can quantify how well your agents are performing and make adjustments should you need improvement.
How to Measure First Response Time?
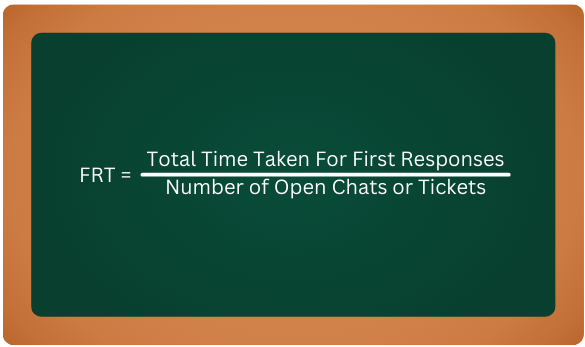
To measure FRT, you will need to collect the data through a platform like ours. A software allows you to see the first response time by sorting through open tickets or chats and then add all of it up and divide it with the number of tickets.
All this should be done within a specific time period that you have decided to evaluate. Here is the formula.
An Example of Calculating FRT
Let’s say your total first response time was about 170 seconds in a day for 30 open chats and tickets. Dividing 170 by 30 gives you 5.67 seconds, which means an agent took around six seconds on average to make their first response to a customer.
First Contact Resolution (FCR)
Evaluating customer support on a different front, FCR shows businesses the percentage of support tickets or chats that have been resolved in the first conversation. So, FCR quantifies the effectiveness of an agent by checking their ability to resolve problems quicker.
As customers would love their issues to be solved quickly and in the first conversation chain, FCR is an excellent metric that businesses can use to gauge how effective they are at resolving queries fast. Using this metric, you can improve your customer support team and raise the satisfaction level of users.
How to Measure First Contact Resolution?
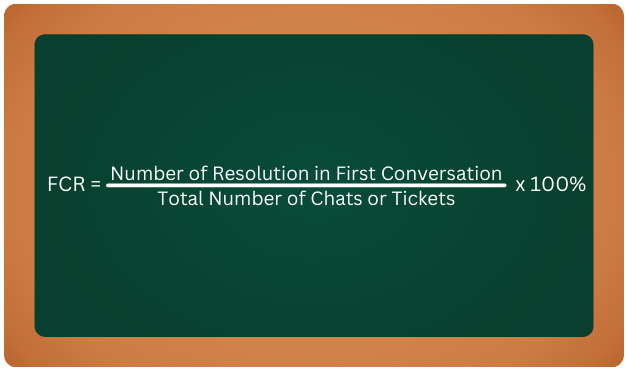
The method to measure FCR is fairly straightforward, as you divide the number of tickets resolved in the first try by the number of total tickets. This data is taken for a time period that you have decided to check up on. After dividing the value, you multiply it by 100% to find the value of FCR.
Here is the formula for first contact resolution.
An Example of Calculating FCR
Let’s say your agents have resolved 150 tickets in one month with 75 of them resolved at the first go-around. You then divide 75/150 and then multiply with 100%. The FCR value for this example will be 50%.
Abandonment Rate
One of the more specific metrics in terms of customer satisfaction is the abandonment rate. You may be thinking as to why this metric is important, and that is because it shows what percentage of your customers have abandoned any interaction they were doing with your website.
This includes tasks like leaving a live chat conversation midway, cutting a phone call suddenly, not checking out products in their cart, and so on. Abandonment rate, also known as Abandon Rate, can actually tell you a lot about your business depending on which area of your company you are evaluating. Usually, this metric is used to assess customer support teams, call centers, and ecommerce or retail websites.
Hence, measuring abandonment rate depends a lot on your area of study and how you can interpret the results and improve your business.
How to Measure Abandonment Rate?
To calculate your abandonment rate, you need to analyze situations that are only applicable to your business. These could be:
- Evaluation amount of carts not checked out
- Live chat conversations not completed
- Calls cut during the middle of a conversation
There are some more indicators, but these are the key ones. In terms of data, once you pick the instances you want to evaluate, you gather the relevant data. The data can be the total number of calls, the total number of checkouts, and so on.
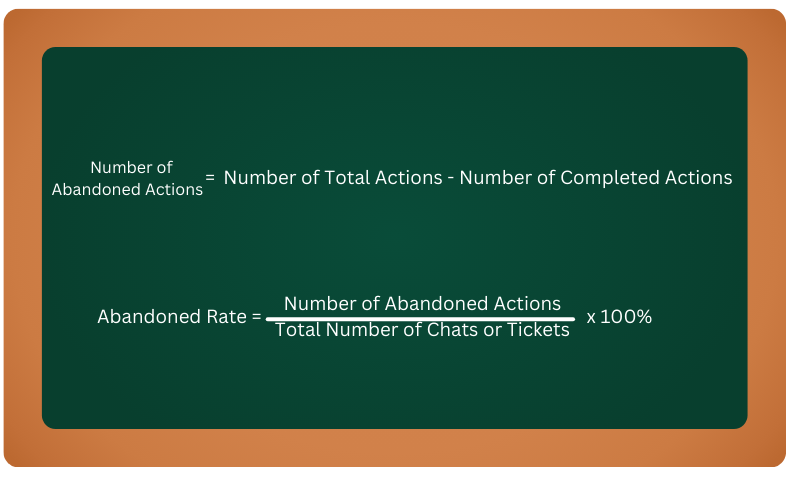
For calculating abandonment rate, you first take the data for the total number of actions for that instance and subtract it by the total number of completed actions. That means that if you were evaluating the number of calls, then you would determine a time frame and take the number of calls you completed within that time and subtract it by the completed calls number.
After that, you divide that result by the total number of actions and then multiply by 100 for the percentage. Here are the formulas.
An Example of Calculating Abandonment Rate
As an example, let’s say we want to evaluate the number of ecommerce carts abandoned in a month for a website. The website had 230 carts that had items added to them, and 150 of them were completed checkouts. From that, you can find out the number of carts abandoned by subtracting the two data points to find 70 carts were not completed.
Next, you divide 70 by the total number (230) and then multiply by 100% to find the abandonment rate to be 30.4%.
How to Boost Customer Satisfaction Metrics?
When you measure the metrics, you can find a lot of numbers that can guide you to improve your business. However, it is equally important to collect the data and customer feedback as efficiently and comprehensively as possible.
To learn more about customer satisfaction strategies, please take a look at this blog.
Thus, here are some ways you can do just that to boost the customer satisfaction metrics you choose to evaluate for your business.
Collecting Feedback on a Regular Basis
By polling your customers periodically, you not only collect a lot of data but, at the same time, get an idea of whether customer sentiment is changing over time in a negative or positive way.
Make use of social media polls, surveys, reviews, and such to further improve metrics like CSAT and NPS that are dependent on customer feedback.
Analyzing Feedback or Data Properly
Collecting information is the first part of executing the calculations for the metrics. Next, you have to sort out the information, which you can use for several purposes.
- To calculate values for the individual formulas
- Understanding customer sentiment in general
- Identifying and solving customer pain points
- Improving customer touchpoints
Overall, feedback gained from customers and data analyzed can unveil a lot of areas for improvement, and for your business to succeed, you should definitely make use of it.
Improving Customer Experience
By using the metrics as an indicator, you can figure out how to improve customer experience through UI updates, readability changes, and more.
That way, you are improving customer satisfaction metrics like CHS and CES since users are finding it easier to interact with your business. The entire process is a cycle of improvement that you can use to improve customer retention and reduce churn rate.
Upgrading Customer Support
Empowering your employees and agents can improve overall customer support. Hence, customers are getting a better experience, and your employees are happy.
Thus, almost all metrics related to customer satisfaction receive a huge boost, and your business flourishes.
Final Thoughts
There are so many metrics available that businesses can use to determine how satisfied their customers are. Thus, we have listed out some of the important ones that you can use to improve your business.
To help you with calculating these metrics and collecting data or feedback, you can use some survey tools or customer service tools like ours to make your overall process easier.
Your customers deserve the best, and through the metrics, benefits, and more, we have provided you with the information and tools to take your business to the next level.
Frequently Asked Questions
A Customer Satisfaction Metric is a criterion through which we can measure whether a customer is satisfied with the service or product of a business.
To measure customer satisfaction, you can use different metrics like CSAT, NPS, CES, and others. These metrics will give you a 360 view of your business and how you can improve it.
Customer satisfaction KPIs consist of metrics like Net Promoter Score (NPS), Customer Effort Score (CES), CSAT, and more.


![How to Write an Apology Letter to Customer [ 24 Templates, Mistakes & Tips ]](https://www.revechat.com/wp-content/uploads/2024/05/pology-letter-to-a-customer.webp)